Penis Size Chart: Small, Average, and Large (With Real Data)
Understanding penis size is not just about numbers. This chart shows what counts as small, average, or large based on aggregated scientific data and how size is distributed across the population.
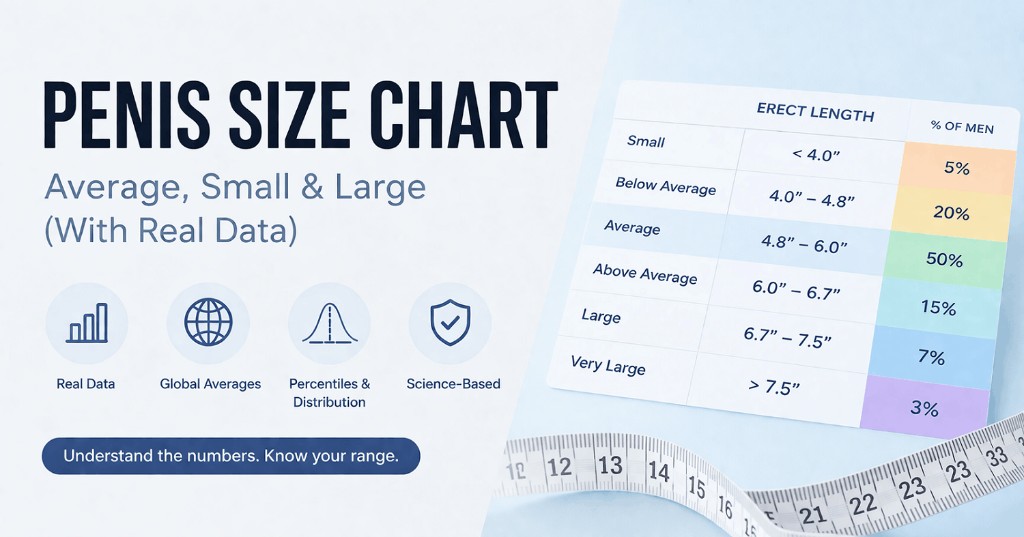
Quick Answer
- - Average size: 5.4-5.5 inches (13.8-14 cm)
- - Most men fall between: 5.2-5.9 inches
- - 6.5 inches: above average
- - 7+ inches: top ~5-10%
- - 8+ inches: extremely rare
Penis Size Chart (Erect Length; Global Average)
This chart is based on global averages using aggregated data from multiple scientific studies. It reflects real distribution, not self-reported estimates. Instead of focusing only on averages, it shows how sizes are spread across the population, helping you understand both typical ranges and rare extremes.
| Category | Range (Inches) | Out of 100 Men | Interpretation |
|---|---|---|---|
| Barely There | < 3.5" | ~1 | Extremely rare |
| Pocket Size | 3.5–3.9" | ~2 | Very uncommon |
| Compact | 3.9–4.3" | ~5 | Below average |
| Lean | 4.3–4.7" | ~10 | Slightly below |
| Close to Average | 4.7–5.2" | ~15 | Near average |
| Right in the Middle | 5.2–5.5" | ~20 | Most common |
| Solid Average | 5.5–5.9" | ~20 | Most common |
| Above the Curve | 5.9–6.3" | ~15 | Above average |
| Noticeably Big | 6.3–6.7" | ~7 | Larger than most |
| Big League | 6.7–7.1" | ~3 | Top ~10% |
| Rare Territory | 7.1–7.5" | ~1–2 | Rare |
| Elite Range | 7.5–8.0" | ~0.5–1 | Very rare |
| Top Tier | 8.0–8.7" | ~0.2–0.5 | Top <0.5% |
| Outlier Zone | > 8.7" | <0.1 | Extreme outlier |
What These Numbers Actually Mean
- - Most men are clustered around the average.
- - Fewer men appear as you move away from the center.
- - Extremely small and extremely large sizes are rare.
- - Around 5.5 inches sits at the center of the distribution.
- - The range 5.2-5.9 inches contains the largest group of men.
- - At 6.5 inches, you are already above most of the population.
- - At 7 inches, you are in a relatively small minority.
- - At 8 inches or more, you are in a statistically rare category.
Want a More Personal Answer?
The chart shows the overall distribution, but it does not tell you exactly where your measurements fall.
See how your size is likely to be perceived
Find Your Size Category
Enter your measurement to quickly see where you fall in the chart.
Use Your Result
Once you know your category, the next step depends on what you want to understand.
Penis Girth Chart (Erect)
Length is often the focus of discussion, but girth plays an equally important role in how size is perceived.
| Category | Range (Inches) | Out of 100 Men | Interpretation |
|---|---|---|---|
| Pencil Thin | < 3.1" | ~1 | Extremely rare |
| Slim | 3.1–3.5" | ~3 | Uncommon |
| Lean Build | 3.5–3.9" | ~7 | Below average |
| Slightly Slim | 3.9–4.3" | ~15 | Slightly below |
| Average Fit | 4.3–4.6" | ~20 | Common |
| Solid Build | 4.6–4.9" | ~20 | Common |
| Thick Side | 4.9–5.3" | ~15 | Above average |
| Thick | 5.3–5.7" | ~10 | Noticeably thick |
| Heavyweight | 5.7–6.1" | ~5 | Rare |
| Absolute Unit | > 6.1" | ~1–2 | Extremely rare |
Why Girth Matters
- - Average girth is around 4.5-4.7 inches (11.5-12 cm).
- - Small increases in girth create more visible differences than similar increases in length.
- - Extreme values are rarer than most people assume.
Girth Matters Most for Condom Fit
If you are trying to find the right condom size, girth is usually more important than length. A better fit can improve comfort, security, and overall experience.
Flaccid Size Chart
Flaccid size varies more than erect size due to factors like temperature, stress, and environment. However, consistent averages still exist.
Flaccid Length
| Category | Range (Inches) | Out of 100 Men | Interpretation |
|---|---|---|---|
| Minimal | < 2.0" | ~1 | Extremely rare |
| Very Compact | 2.0–2.4" | ~3 | Uncommon |
| Compact | 2.4–2.8" | ~7 | Below average |
| Lean | 2.8–3.2" | ~15 | Slightly below |
| Average (Lower) | 3.2–3.6" | ~20 | Common |
| Average (Upper) | 3.6–4.0" | ~20 | Common |
| Above Average | 4.0–4.5" | ~15 | Above average |
| Large | 4.5–5.0" | ~10 | Larger than most |
| Rare Large | > 5.0" | ~5 | Rare |
Flaccid Girth
| Category | Range (Inches) | Out of 100 Men | Interpretation |
|---|---|---|---|
| Ultra Slim | < 2.6" | ~2 | Rare |
| Slim | 2.6–3.0" | ~8 | Below average |
| Slightly Slim | 3.0–3.3" | ~20 | Slightly below |
| Average Fit | 3.3–3.6" | ~25 | Common |
| Solid Fit | 3.6–3.9" | ~25 | Common |
| Thick Side | 3.9–4.3" | ~15 | Above average |
| Thick | > 4.3" | ~5 | Rare |
Understanding Flaccid Variation
Flaccid measurements are less stable than erect measurements, which is why comparisons based on erect size are generally more meaningful. Flaccid data still shows a clear average range, a similar distribution pattern, and less variation in girth compared with length.
Compare Other Studies
The global dataset is the best baseline. Other datasets shift the average slightly, while the same overall distribution shape remains consistent.
Expand to compare datasets
Western Average
Erect Length
| Category | Range (Inches) | Out of 100 Men | Interpretation |
|---|---|---|---|
| Barely There | < 3.7" | ~1 | Extremely rare |
| Pocket Size | 3.7–4.1" | ~2 | Very uncommon |
| Compact | 4.1–4.5" | ~5 | Below average |
| Lean | 4.5–4.9" | ~10 | Slightly below |
| Close to Average | 4.9–5.4" | ~15 | Near average |
| Right in the Middle | 5.4–5.7" | ~20 | Most common |
| Solid Average | 5.7–6.1" | ~20 | Most common |
| Above the Curve | 6.1–6.5" | ~15 | Above average |
| Noticeably Big | 6.5–6.9" | ~7 | Larger than most |
| Big League | 6.9–7.3" | ~3 | Top ~10% |
| Rare Territory | 7.3–7.7" | ~1–2 | Rare |
| Elite Range | 7.7–8.2" | ~0.5–1 | Very rare |
| Top Tier | 8.2–8.9" | ~0.2–0.5 | Top <0.5% |
| Outlier Zone | > 8.9" | <0.1 | Extreme outlier |
- - 4.7 inches -> average
- - 5.2 inches -> above average
- - 5.7+ inches -> thick
- - 6+ inches -> rare
Erect Girth
| Category | Range (Inches) | Out of 100 Men | Interpretation |
|---|---|---|---|
| Pencil Thin | < 3.3" | ~1 | Extremely rare |
| Slim | 3.3–3.7" | ~3 | Uncommon |
| Lean Build | 3.7–4.1" | ~7 | Below average |
| Slightly Slim | 4.1–4.5" | ~15 | Slightly below |
| Average Fit | 4.5–4.8" | ~20 | Common |
| Solid Build | 4.8–5.1" | ~20 | Common |
| Thick Side | 5.1–5.5" | ~15 | Above average |
| Thick | 5.5–5.9" | ~10 | Noticeably thick |
| Heavyweight | 5.9–6.3" | ~5 | Rare |
| Absolute Unit | > 6.3" | ~1–2 | Extremely rare |
Eastern Average
Erect Length
| Category | Range (Inches) | Out of 100 Men | Interpretation |
|---|---|---|---|
| Barely There | < 3.3" | ~1 | Extremely rare |
| Pocket Size | 3.3–3.7" | ~2 | Very uncommon |
| Compact | 3.7–4.1" | ~5 | Below average |
| Lean | 4.1–4.5" | ~10 | Slightly below |
| Close to Average | 4.5–5.0" | ~15 | Near average |
| Right in the Middle | 5.0–5.3" | ~20 | Most common |
| Solid Average | 5.3–5.7" | ~20 | Most common |
| Above the Curve | 5.7–6.1" | ~15 | Above average |
| Noticeably Big | 6.1–6.5" | ~7 | Larger than most |
| Big League | 6.5–6.9" | ~3 | Top ~10% |
| Rare Territory | 6.9–7.3" | ~1–2 | Rare |
| Elite Range | 7.3–7.8" | ~0.5–1 | Very rare |
| Top Tier | 7.8–8.5" | ~0.2–0.5 | Top <0.5% |
| Outlier Zone | > 8.5" | <0.1 | Extreme outlier |
- - 4.3 inches -> average
- - 4.8 inches -> above average
- - 5.3+ inches -> thick
- - 5.8+ inches -> rare
Erect Girth
| Category | Range (Inches) | Out of 100 Men | Interpretation |
|---|---|---|---|
| Pencil Thin | < 3.0" | ~1 | Extremely rare |
| Slim | 3.0–3.4" | ~3 | Uncommon |
| Lean Build | 3.4–3.8" | ~7 | Below average |
| Slightly Slim | 3.8–4.2" | ~15 | Slightly below |
| Average Fit | 4.2–4.5" | ~20 | Common |
| Solid Build | 4.5–4.8" | ~20 | Common |
| Thick Side | 4.8–5.2" | ~15 | Above average |
| Thick | 5.2–5.6" | ~10 | Noticeably thick |
| Heavyweight | 5.6–6.0" | ~5 | Rare |
| Absolute Unit | > 6.0" | ~1–2 | Extremely rare |
What This Comparison Shows
- - The overall distribution shape stays the same.
- - The average shifts slightly, but not dramatically.
- - Most people still fall within a similar range.
How Penis Size Is Distributed
Penis size follows a statistical pattern similar to many biological traits.
- - Most values cluster near the average.
- - Fewer individuals appear as you move toward extremes.
- - Extreme values exist, but are rare.
What This Means
- - “Average” covers a wide range.
- - Small differences near the center are very common.
- - Large differences at the extremes are uncommon.
- - This helps avoid misconceptions from anecdotal comparisons or unrealistic expectations.
How to Measure Correctly
- - Measure length from the base to the tip.
- - Press into the pubic bone for consistency (bone-pressed method).
- - Measure girth around the thickest part.
- - Use a ruler for length and flexible tape (or string) for girth.
What Does That Actually Look Like?
Numbers alone do not always reflect visual appearance. Two measurements that seem close on paper can look very different in real life.
👉 See what your size looks like
Want a Simple Breakdown?
Some people want the full chart. Others just want a straightforward answer. Choose the tool that fits what you want to know:
Data Source
This chart is based on aggregated peer-reviewed data, including Veale D, Miles S, Bramley S, et al. (2015), Am I normal? A systematic review and construction of nomograms, BJU International. Additional modeling aligns with datasets aggregated by calcSD.
Final Thoughts
Most men fall within the average range, and variation is completely normal. The purpose of this chart is not to define what is “ideal,” but to provide accurate context. Understanding distribution helps replace assumptions with data.